
Climate policy - effective & fair
CONTENTS
Reference values - weighting population:Figures:
vs. targets 2030
Data base: EEA
Data base: SRU
Extended smooth Pathway Model (ESPM)
in the ESPM with different framework data
Short introduction
Core question: distribution of a global CO2 budget
CO2 affect the climate for a long time. Therefore, remaining global CO2 budgets correspond to certain limits of global warming. Here are key statements of the IPCC on remaining CO2 budgets. Which concrete global budget we want to orientate, however, must ultimately be decided politically on the basis of the current state of scientific knowledge.
Such a global budget raises the question of how it can be distributed amongst the countries in a fair and economically reasonable way. Such a distribution should be an important guidance of the ratchet up mechanism (ambition mechanism) of the Paris Agreement with Nationally Determined Contributions (NDCs).
Basic idea behind the Extended Smooth Pathway Model (ESPM) - brief background
- National budgets: A predefined global CO2 budget is distributed to countries. The ESPM-Tools offers the use of a weighted distribution key which contains the "population" and the "emissions" in a base year.
- National paths: The ESPM tool offers the Regensburg Model Scenario Types RM 1 - 6 (brief description) to derive plausible national paths that adhere to a national budget.
The key framework data
The most important framework data to be decided politically are:- Concrete remaining global CO2 budget as a guidance figure (IPCC AR6 WG I:
 )
) - Distribution of a global budget
How can a global carbon budget be distributed fairly and in an economically reasonable way among countries?
For the following results in the ESPM, the global budget was distributed to the countries using a weighted distribution key. The distribution key contains the proportion of the population and the proportion of emissions in a base year (here: 2019). The distribution key thus maps the two most important factors: Current reality and climate justice. The weighting of the population is the selectable parameter. - Potential for net negative emissions
This potential is indicated in the ESPM by specifying a minimum value for annual emissions up to the year 2100. If this value is negative, a temporary overshoot is possible in the ESPM tools, which is offset by net negative emissions until 2100. A minimum of zero was assumed in the following exemplary reference values. Thus, no quantity overshoot is assumed in the following reference values. - Sensible course of the national emission paths (Regensburg Model Scenario Types)
With the help of the Regensburg Model Scenario Types, different courses can be mapped that adhere to a predefined budget:
- RM-3-lin: linear course of the annual reduction rates
- RM-4-quadr: concave course of the annual reduction rates
- RM-5-rad: convex course of the annual reduction rates
- RM-6-abs: constant annual reduction amount (concave course of the annual reduction rates, the emission path is a straight line).
We currently offer a total of six scenario types that cover the range of plausible options well. Here you will find a comprehensive mathematical description of the different RM Scenario Types and here a brief description.
National reference values (targets) and CO2 budgets
Data base: EDGAR (without Land-use change)
- EDGAR: Emissions Database for Global Atmospheric Research - EU Commission
- Tool: ESPM (download)
- Publication: Zenodo, 2021, Paris-compatible emissions targets for the six largest emitters,
Land-use change and international shipping/aviation CO2 emissions
The EDGAR database used here contains the CO2 emissions for all countries in the world due to the use of fossil fuels (excluding international shipping and aviation; ISA) and cement production. The following national CO2 budgets are therefore also without LUC and ISA.
The global LUC budget until 2100 is assumed to be zero in the following reference values. This implies that in total net positive LUC emissions will be offset by net negative LUC emissions until 2100. Here is more background information.
For the ISA emissions, 3% of the global budget is reserved in the following reference values. This roughly corresponds to their share of current global CO2 emissions.
This value is also an input value in our tools.
RM Scenario Types
The rate of change for the start year is an input value in the ESPM in scenario types RM 2 - 5. For the automated determination of the reference values for the six countries with the highest emissions, the 2019 rate of change was used as the starting value. The value used is given in the PDFs.
The already published actual emissions after 2019 are included in the emission paths..
Weighting population key: 100%
global CO2 budgets 2020 - 2100 |
results for the largest emitters |
|||
|---|---|---|---|---|
Scenario Type:
|
RM-3-lin |
RM-4-quadr |
RM-5-rad |
RM-6-abs |
400 Gt |
||||
550 Gt |
||||
650 Gt |
||||
700 Gt |
||||
Weighting population key: 85%
global CO2 budgets
2020 - 2100 |
results for the largest emitters |
|||
|---|---|---|---|---|
Scenario Type:
|
RM-3-lin |
RM-4-quadr |
RM-5-rad |
RM-6-abs |
400 Gt |
||||
550 Gt |
||||
650 Gt |
||||
700 Gt |
||||
Weighting population key: 70%
global CO2 budgets
2020 - 2100 |
results for the largest emitters |
|||
|---|---|---|---|---|
Scenario Type:
|
RM-3-lin |
RM-4-quadr |
RM-5-rad |
RM-6-abs |
400 Gt |
||||
550 Gt |
||||
650 Gt |
||||
700 Gt |
||||
Weighting population key: 50%
global CO2 budgets
2020 - 2100 |
results for the largest emitters |
|||
|---|---|---|---|---|
Scenario Type:
|
RM-3-lin |
RM-4-quadr |
RM-5-rad |
RM-6-abs |
400 Gt |
||||
550 Gt |
||||
650 Gt |
||||
700 Gt |
||||
Weighting population key: 30%
global CO2 budgets
2020 - 2100 |
results for the largest emitters |
|||
|---|---|---|---|---|
Scenario Type:
|
RM-3-lin |
RM-4-quadr |
RM-5-rad |
RM-6-abs |
400 Gt |
||||
550 Gt |
||||
650 Gt |
||||
700 Gt |
||||
Weighting population key: 15%
global CO2 budgets
2020 - 2100 |
results for the largest emitters |
|||
|---|---|---|---|---|
Scenario Type:
|
RM-3-lin |
RM-4-quadr |
RM-5-rad |
RM-6-abs |
400 Gt |
||||
550 Gt |
||||
650 Gt |
||||
700 Gt |
||||
Weighting population key: 0%
global CO2 budgets
2020 - 2100 |
results for the largest emitters |
|||
|---|---|---|---|---|
Scenario Type:
|
RM-3-lin |
RM-4-quadr |
RM-5-rad |
RM-6-abs |
400 Gt |
||||
550 Gt |
||||
650 Gt |
||||
700 Gt |
||||
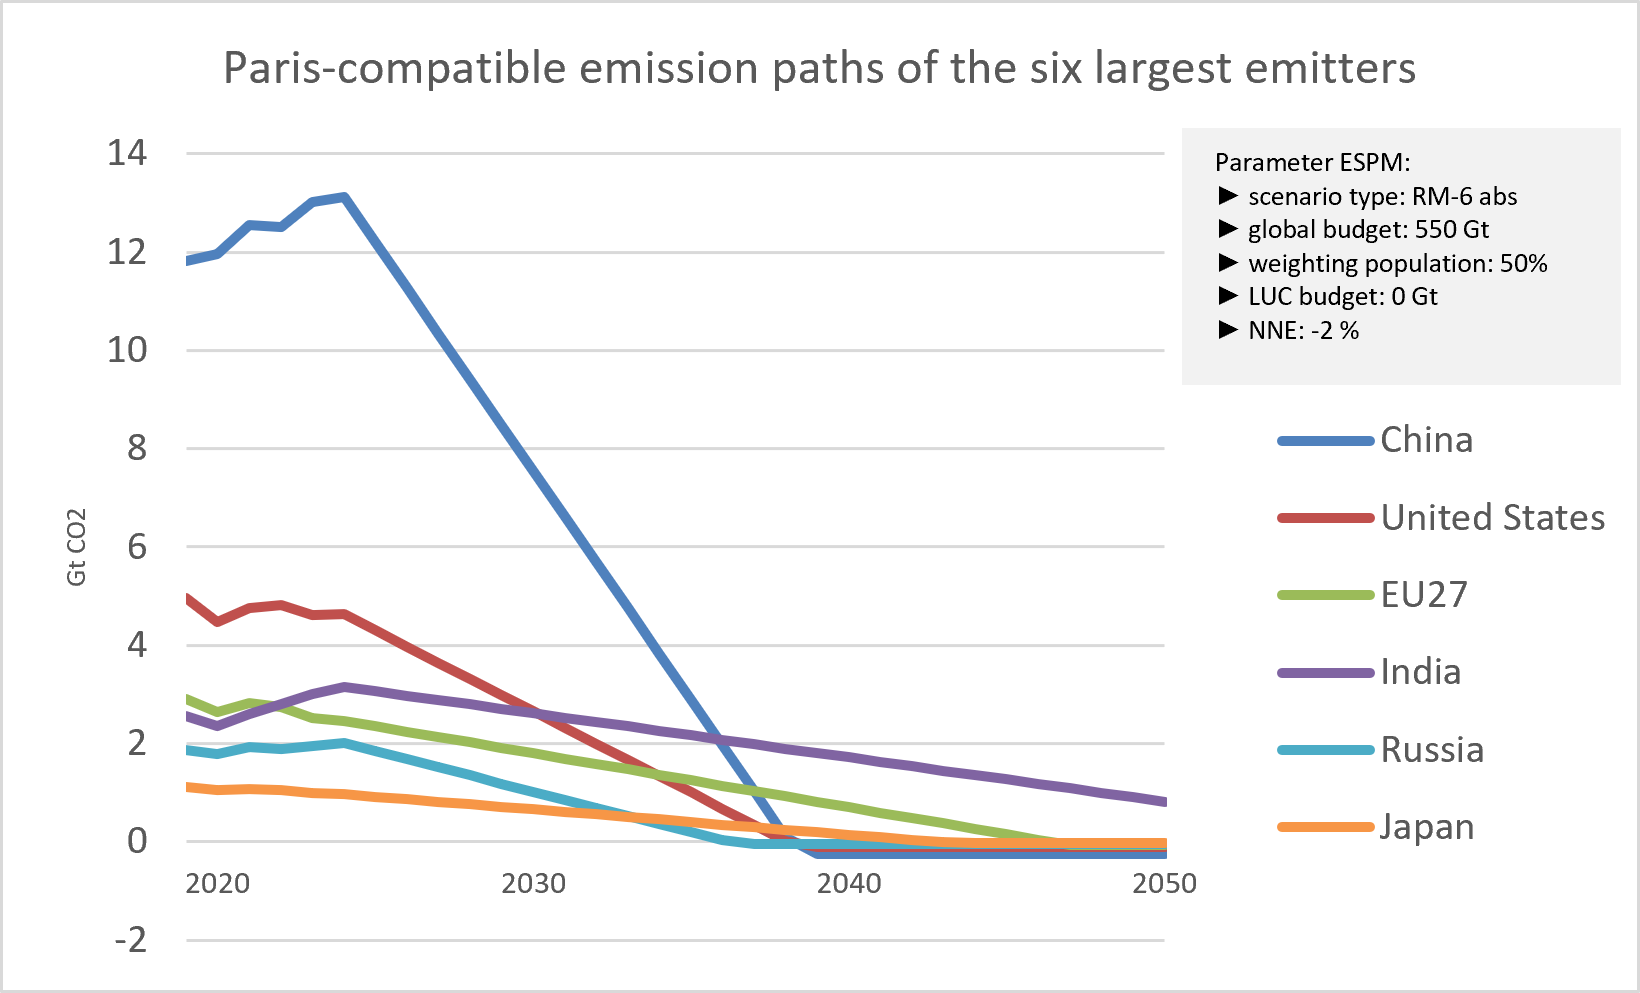
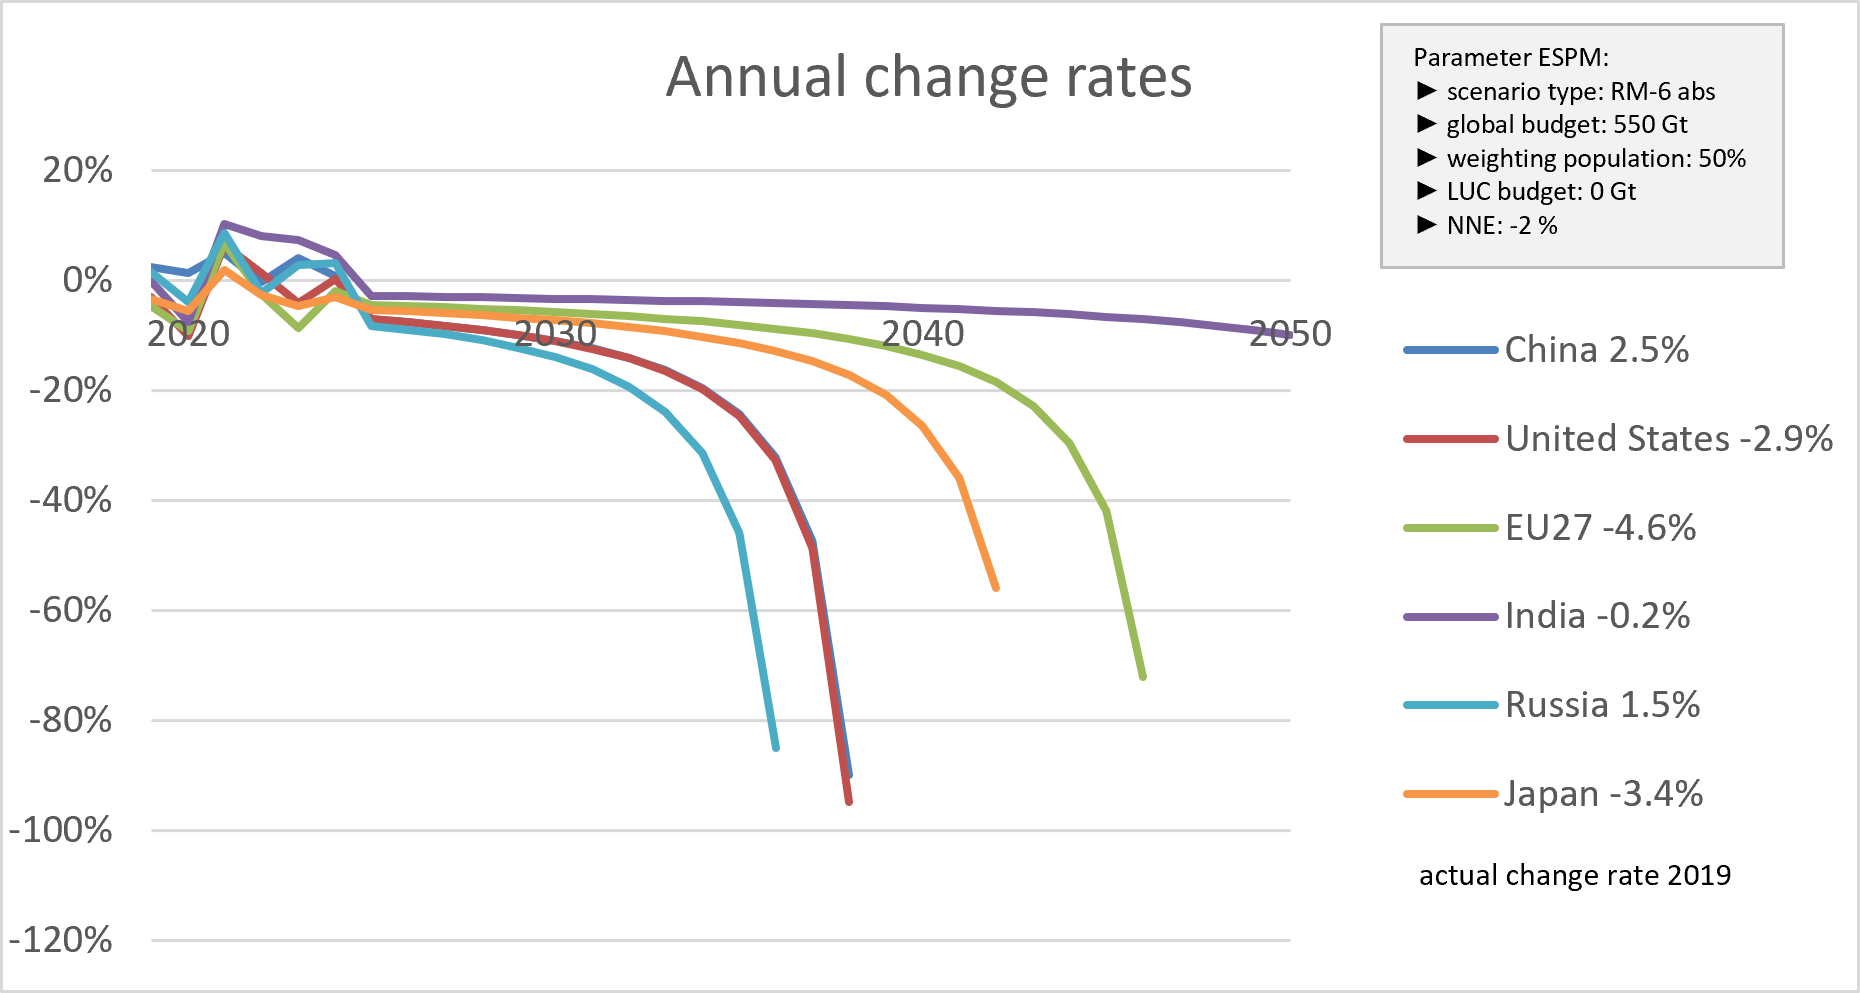
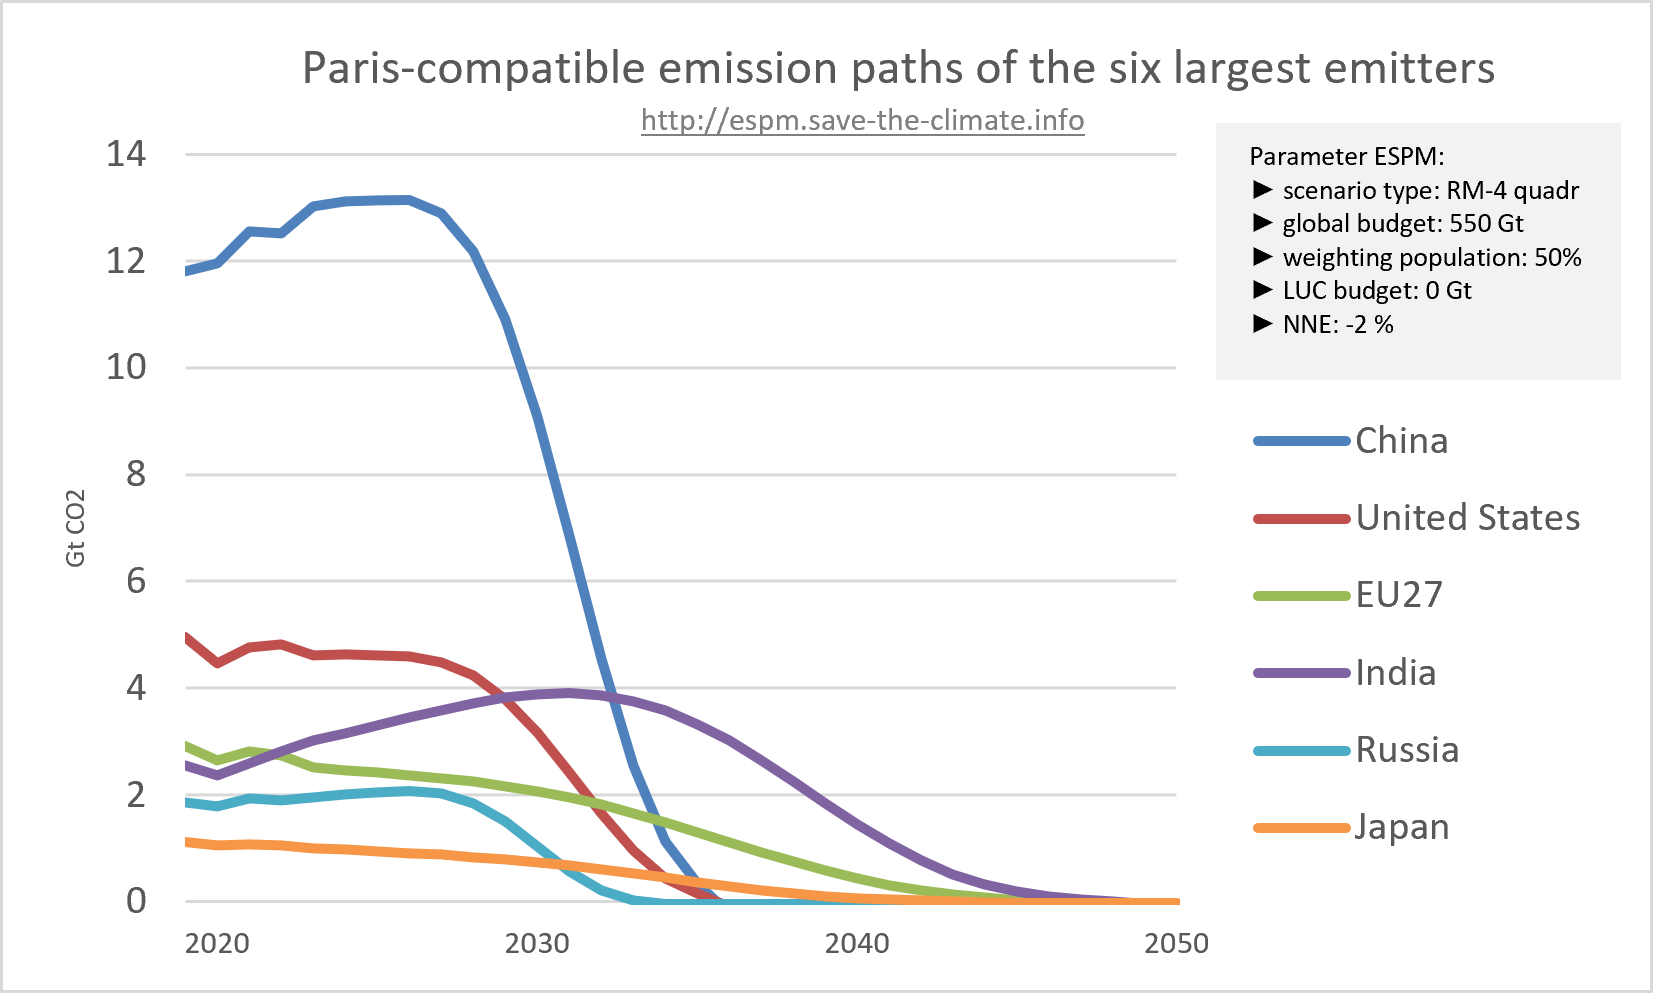
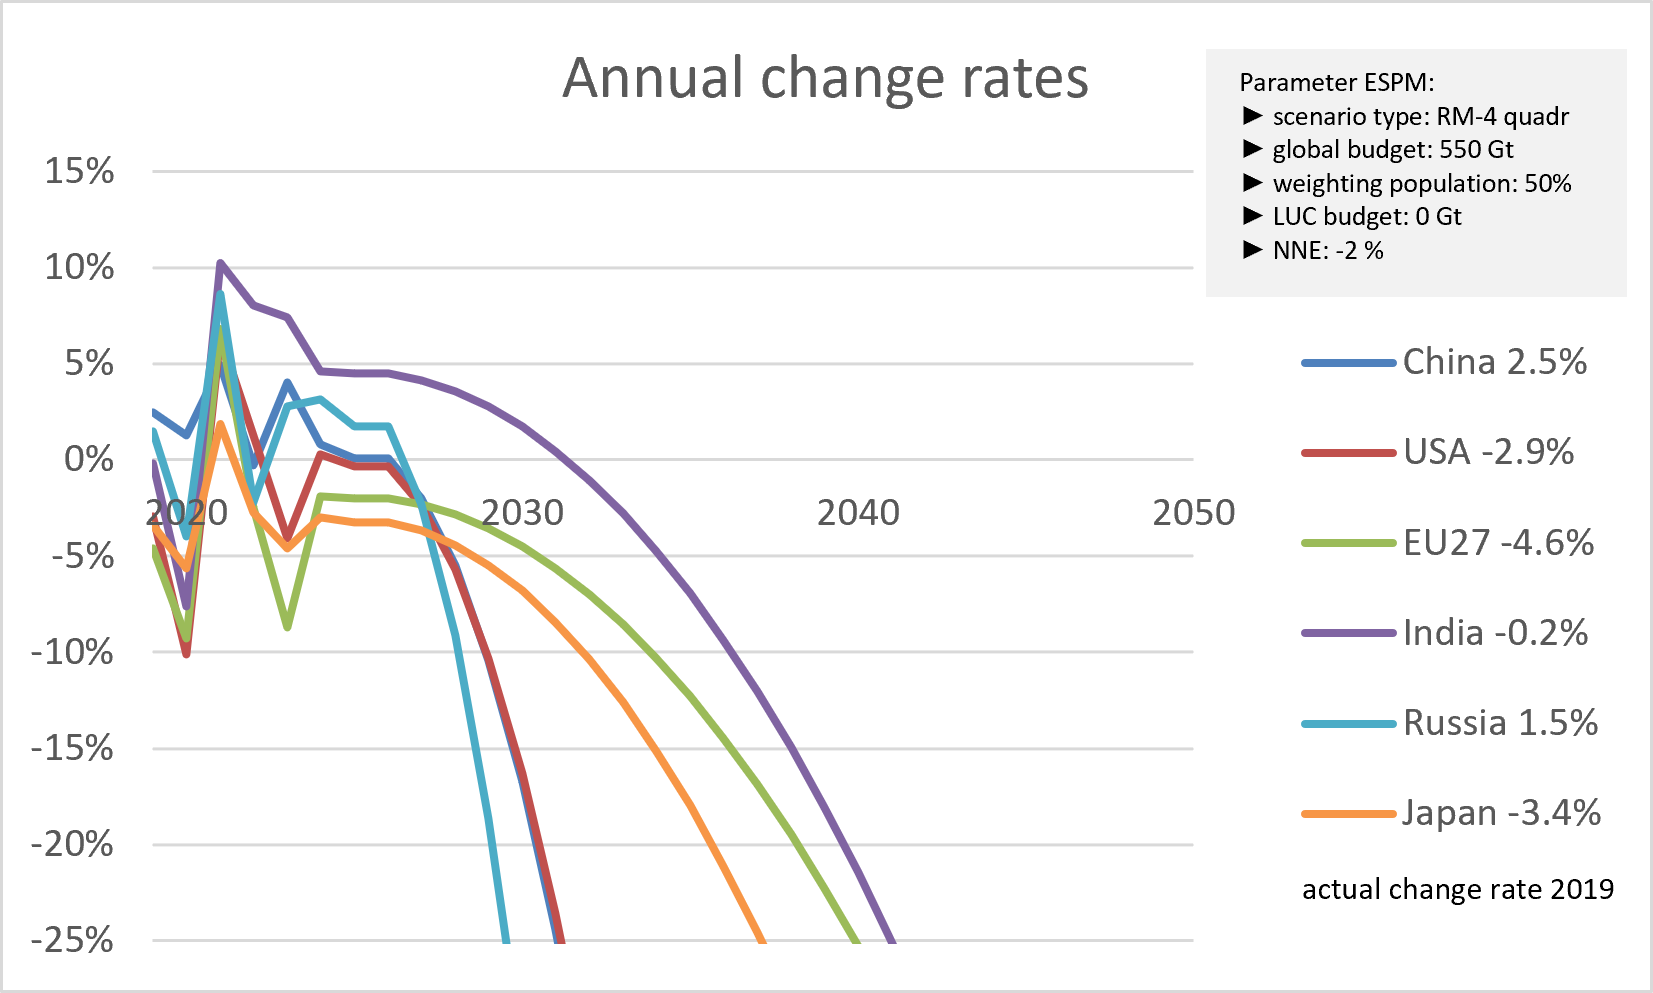
Exemplary emission paths of the six largest emitters
Framework data:
- global CO2 budget 2020 - 2100: 550 Gt
- weighting population: 50%
Different scenario types
In scenario types RM-3 and RM-4, the average of the actual values from 2018, 2019, 2022 and 2023 was used as the starting rate of change. Actual values already published after 2019 are taken into account in the emission paths. In practice, of course, not all countries would need to choose the same scenario type.
- scenario type: RM-6-abs (linear emission paths); corresponding reference values
- scenario type: RM-4-quadr (concave course of the annual change rates); corresponding reference values
- scenario type: RM-3-lin (annual rates of change on a straight line); corresponding reference values
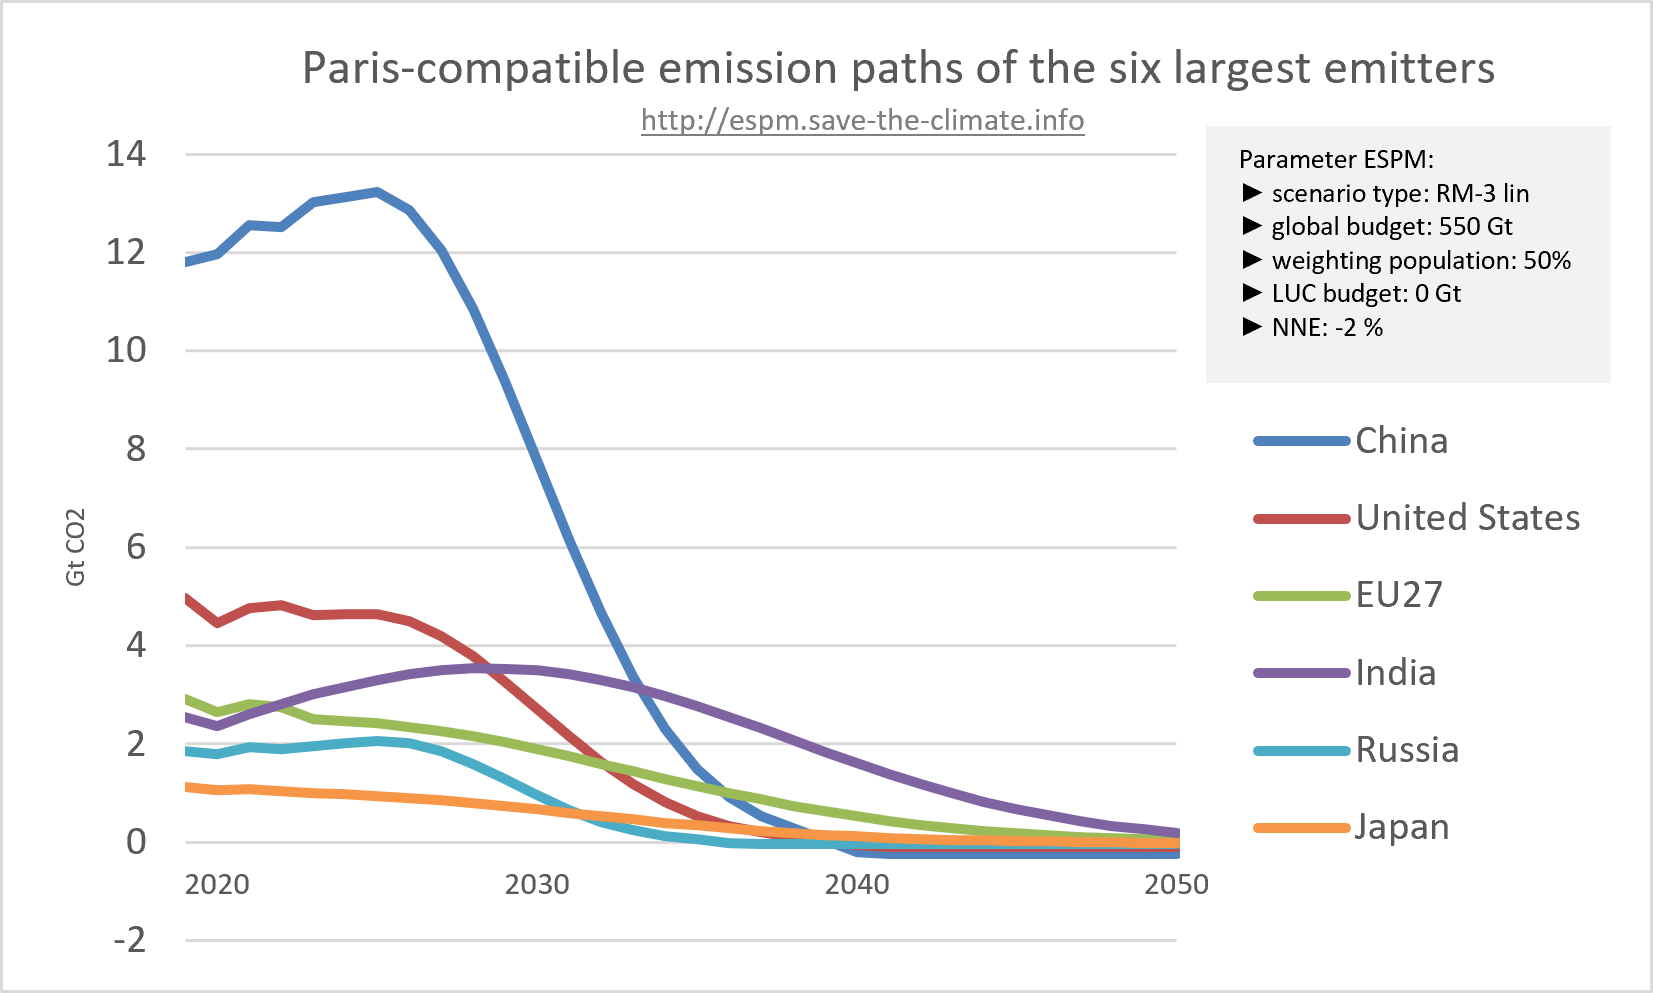
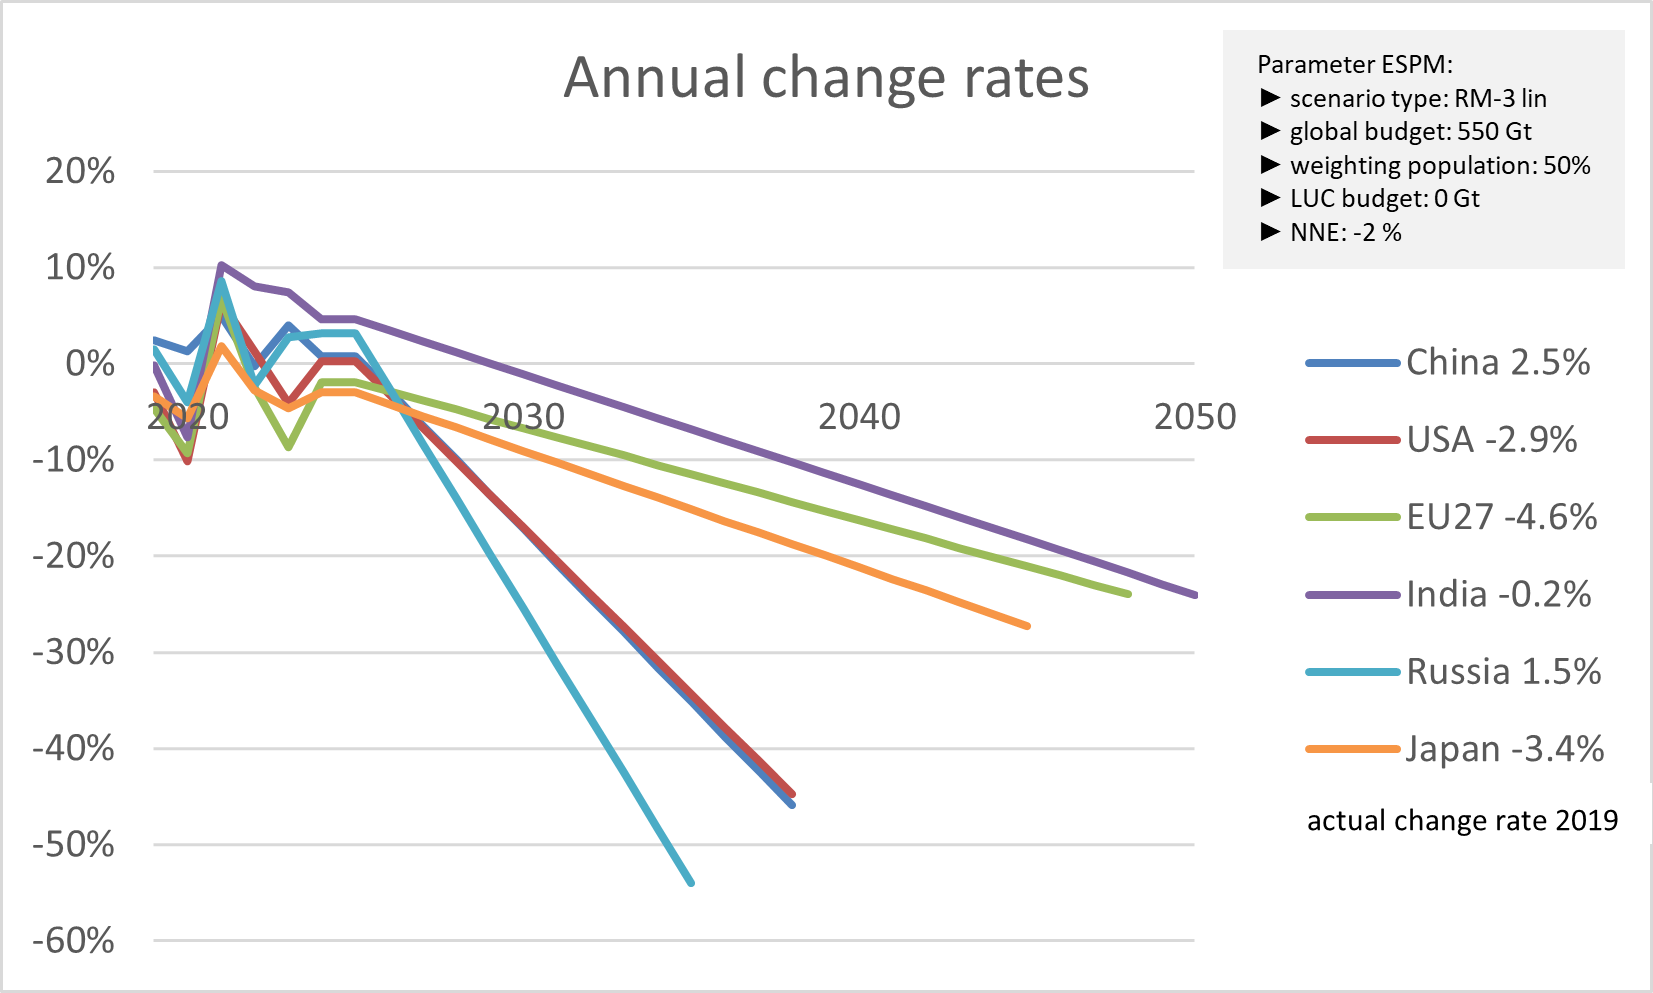
Interpretation:
If China does not reduce its emissions by 2030, there will be a huge gap that others cannot easily make up. We need a discourse on how we want to deal with this fact.
Weighting population vs. targets 2030/2019 of the six largest emitters
Framework data:
- global CO2 budget 2020 - 2100: 550 Gt
- scenario type: RM-6-abs (linear emission paths)
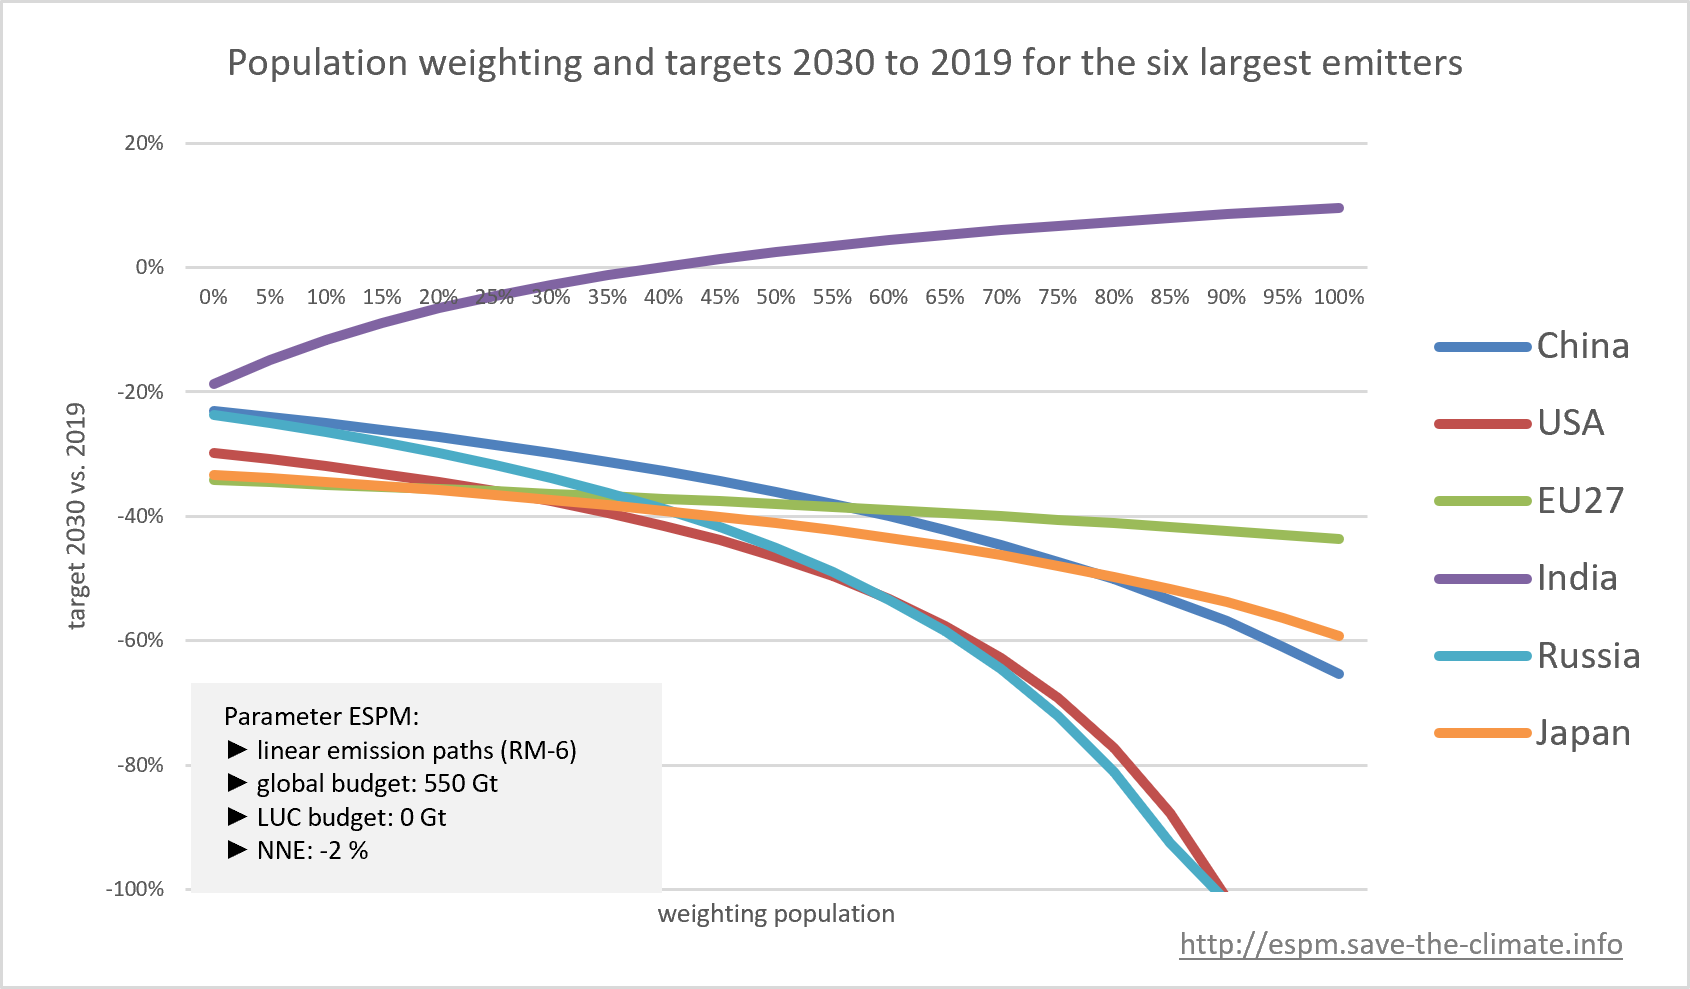
Interpretation:
If the population were weighted at 0% (and thus here an exclusive distribution of the remaining global budget according to the shares of global emissions in 2019: 'grandfathering'), all countries would have the same requirement to reduce their emissions by 2030 compared to 2019. The different values in the graph when weighting the population with 0% are due to the consideration of actual emissions after 2019.
If the population share is included in the distribution key, then countries with higher per capita emissions in 2019 than the global average will face higher ambition requirements and countries with below average per capita emissions (in the chart: India) will have lower ambition requirements.
We need to address the question of what framework data will lead to feasible national targets.
Data base: European Environment Agency (EEA)
- EEA provides data for all CO2 emissions (including ISA and LUC) for the EU.
- Used tools:
- Web app: http://eu.national-budgets.climate-calculator.info
- Excel Tool - paths: Download
- Publications:
Zenodo, 2022, Paris-compatible emission targets for Germany and the EU,
A few selected results for the EU are calculated using our general tool for determining emission paths that meet a certain budget (status: November 2022). The following reference values include LUC and ISA.
global CO2 budgets
2020 - 2100 |
weighting
population key |
overview of
EU27 results |
400 Gt
|
50%
|
|
550 Gt |
||
650 Gt
|
100% |
Data base: German Advisory Council on the Environment (SRU)
Parameters environmental report 2020 of the SRU- weighting population 100% from 2016 on
- we use here the SRU data for both remaining budgets and emissions data
- calculated using our general tool for determining emission paths that meet a certain budget (download)
global CO2 budgets from 2018 on (IPCC SR1.5) |
EU28 |
Germany |
580 Gt |
||
800 Gt SRU: Maximum global budget that is still compatible with keeping a global temperature rise this century well below 2°C |
Web apps
- for the EU according to the Extended Smooth Pathway Model (ESPM):
 http://eu.climate-calculator.info
 - to calculate Paris-compatible CO2 budgets for all countries in the world:
http://short.national-budgets.climate-calculator.info
http://national-budgets.climate-calculator.info - for calculating emission paths that adhere to a predefined budget:
http://paths.climate-calculator.info - overview web apps
Results request
Here you can query the results for a country via a Google form based on the framework data that you specify; here is a request as a PDF.